What OEE means on an injection molding machine
Overall equipment effectiveness (OEE) multiplies three losses into one number:
OEE = Availability × Performance × Quality
- Availability: running time divided by planned production time. Alarms, mold changes, waiting on material and repairs all take time away.
- Performance: the ideal cycle time divided by the actual cycle time. A mold that should run 20 seconds but runs 22 loses performance.
- Quality: good parts divided by all parts made, including startup scrap and rejects.
A worked example
| Factor | Example shift | Result |
|---|---|---|
| Availability | Ran 7.2 of 8 planned hours | 90.0% |
| Performance | Ideal cycle 20 s, actual 22 s | 90.9% |
| Quality | 1,940 good of 2,000 parts | 97.0% |
| OEE | 0.900 × 0.909 × 0.970 | 79.4% |
Example numbers for illustration, not a customer result.
How CycleWright measures each part
- Status and time come from the harness signals (power, auto, alarm, heats), so every second is accounted for.
- Cycles come from a mold-open or ejector pulse into a PLC counter, or from the machine's own counter over EUROMAP 63 or 77.
- The ideal cycle comes from the job and its routing, so each mold is judged against its own target.
- Rejects come from EUROMAP counters or a reject signal, and inspections add the rest in the ERP.
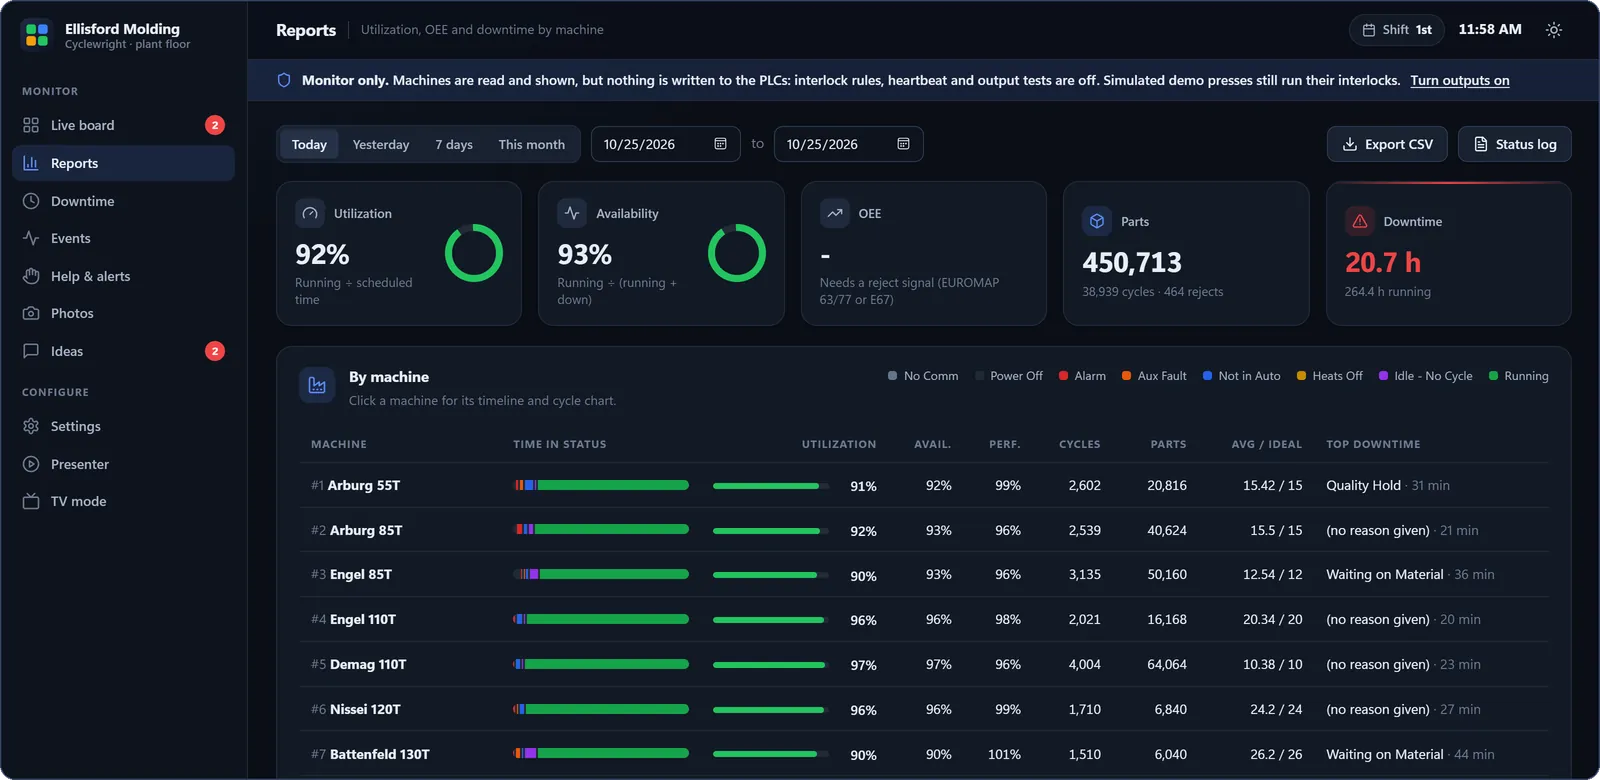
Reports show utilization (running time over scheduled time), availability (running over running plus down), performance, cycles, parts and parts per hour per machine and shift, and OEE wherever reject data is available.
Downtime that logs itself
A stop starts the moment a press leaves running and ends when it runs again, with no one writing anything down. Operators pick the reason at the press; supervisors see every stop without a reason on their phones and can fill it in. Reports rank the top reasons by machine and shift, and everything exports to CSV.
From numbers to action
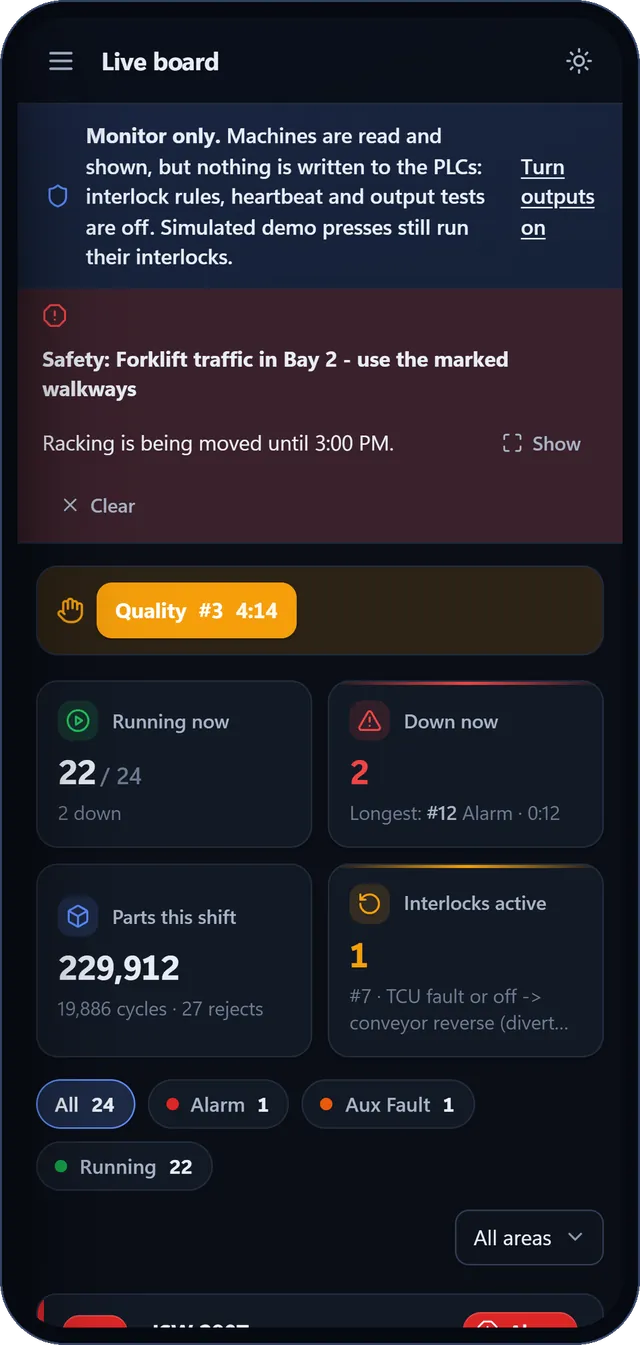
- Alerts by Teams, Slack, SMS or email, for example "Press 12 has been in Alarm for 10 minutes".
- Help calls by role, with a timer everyone can see.
- "What changed?" compares a press with the week before and lists what happened around the change.
- The ERP's profit flag shows what a slow cycle or a stop costs per hour.
Common OEE mistakes in molding
- Judging every mold against one nameplate cycle instead of its own ideal cycle.
- Leaving out startup scrap, which makes quality look better than it is.
- Manual logs that round stops to the nearest 15 minutes, or miss short ones entirely.
- An OEE number without reasons: it tells you that you lost time, not why.